One of the nicest things about digital photography is the immediate gratification - you get to see what you've shot right away. Most everyone checks their photos right after taking them by viewing them on the camera's LCD screen - but checking exposure this way can be a challenge. In bright sunlight, LCD screens are difficult to see - and in ideal conditions, viewing the image to check exposure can be imperfect. Underexposed images may appear brighter than they actually are on the LCD screen - overexposed images may look darker than they are. Fortunately, there is a better way to check your exposures right on your camera - the histogram.
A histogram is a graphic display of your exposure, presenting the tonal values of an image in a graph form. It charts the amount of tones in the image from black to white in a graph that resembles a silhouette of a mountain. The left side of the graph represents shadows, the center area represents mid-tones, and the right side represents highlights.
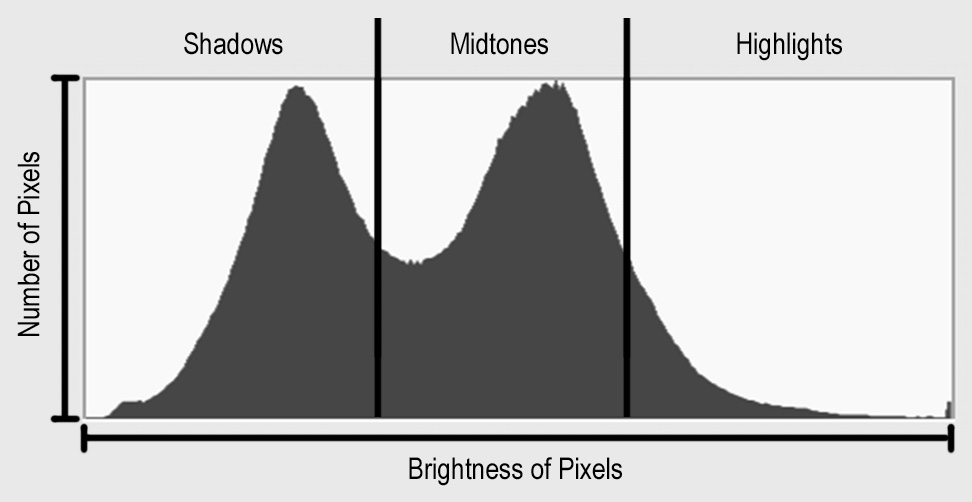
The horizontal axis of the graph represents brightness levels, from absolute black on the left to absolute white on the right. The vertical axis represents the number of pixels that are at that brightness level.
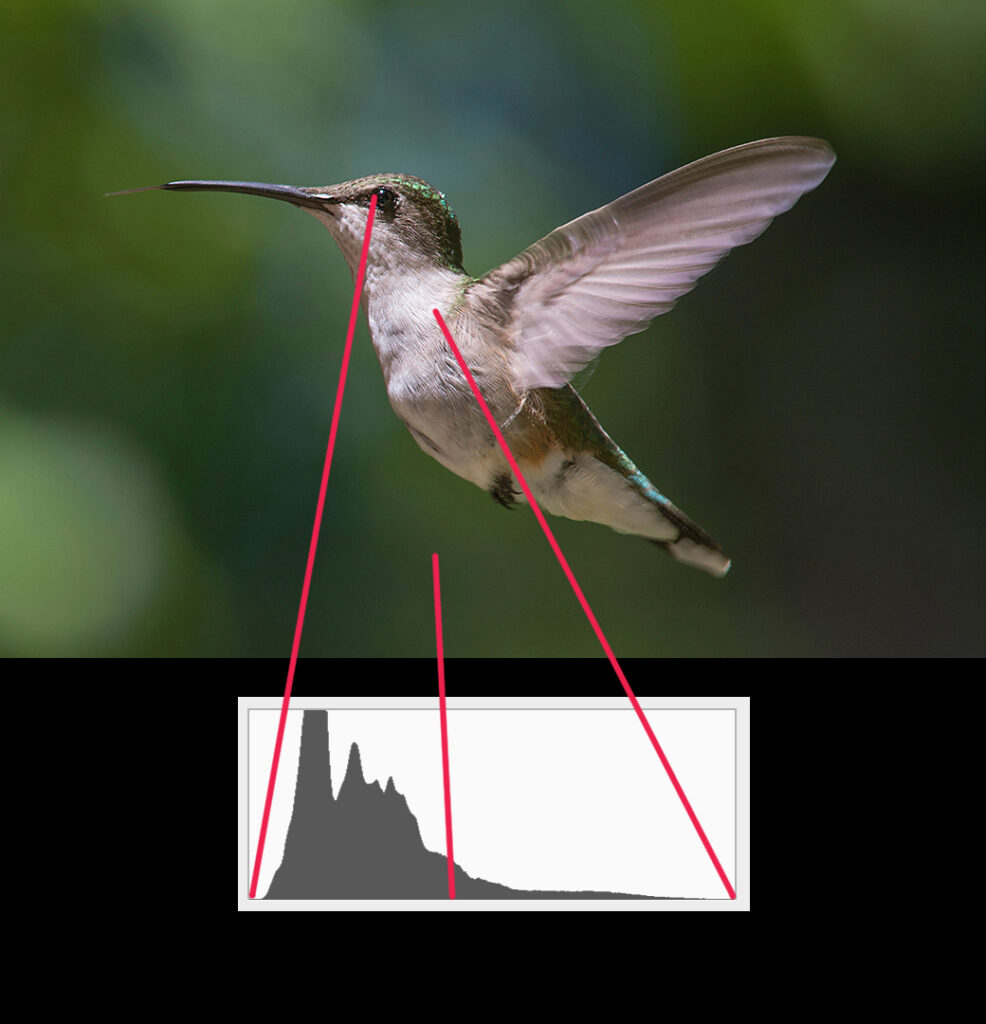
Below is an example of an image and its histogram with examples of shadow areas, mid-tone areas and highlight areas:
An ideal histogram (of an image with average tonalities) will gradually slope from the left, rise up towards the center, then slope gently back down to the right indicating an image with full tonal range while maintaining detail in the shadows as well as the highlights. A histogram that bunches up on the left indicates an image that is underexposed - if the histogram bunches up on the right, the image is overexposed. If the histogram appears to "run off" the edge (the graph abruptly stops on the left or right - or both), then the image has areas without detail due to improper exposure - this is called "clipping". A histogram that abruptly ends on the left side indicates an exposure with block-up shadows - if it ends on the right side, then there are washed-out highlights with no detail. If the histogram cuts off at both ends, then the image has a dynamic range (the range from the darkest darks to the lightest lights) that the camera simply can't record in a single exposure.
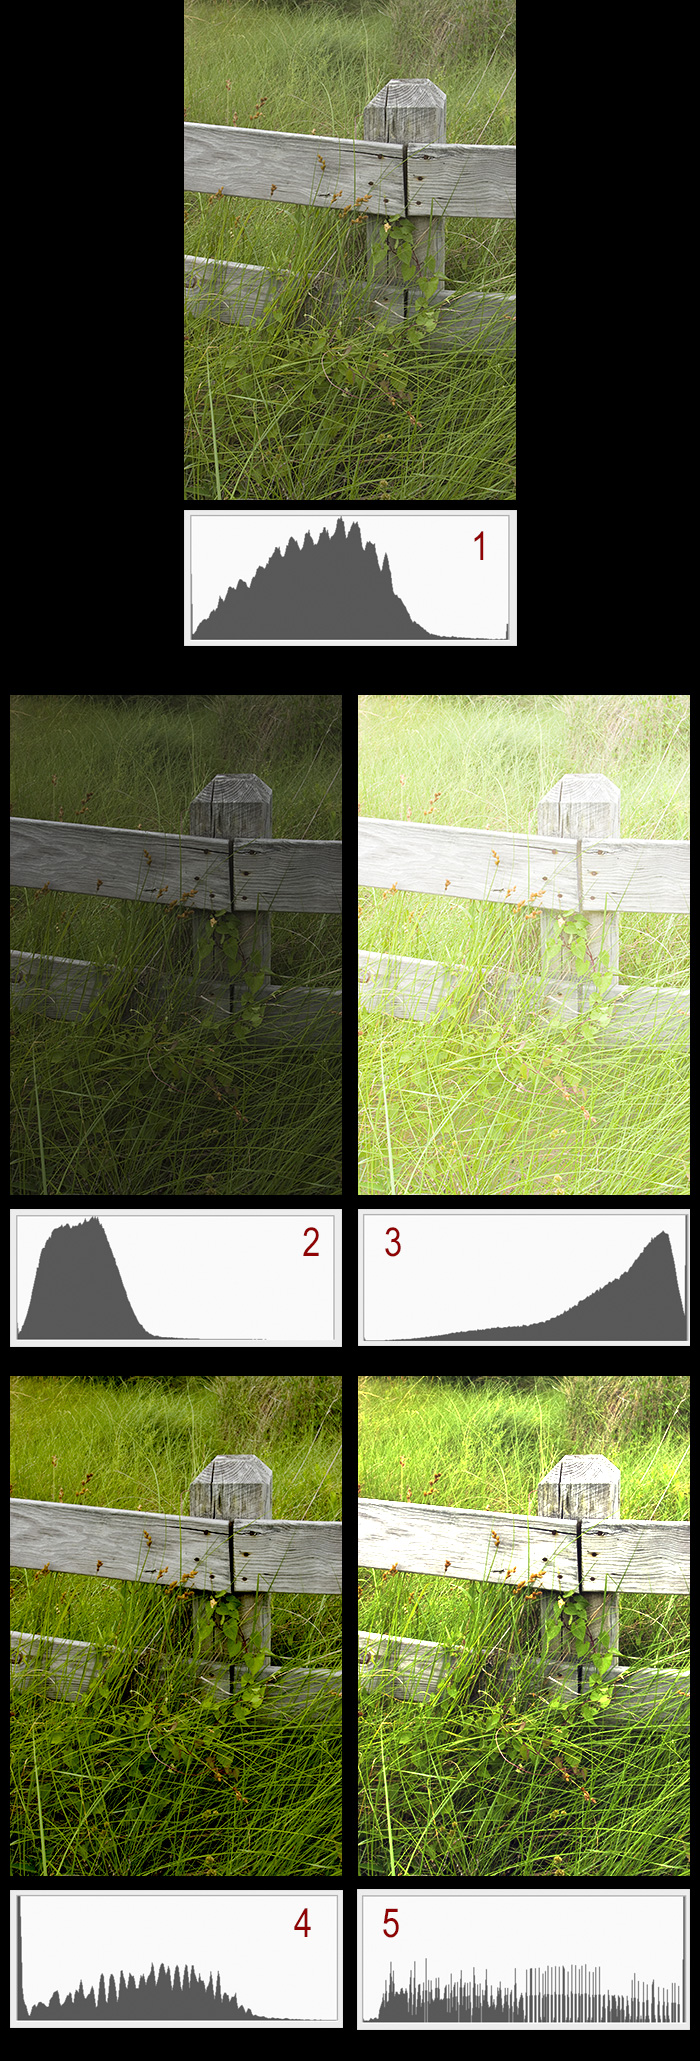
Image 1:
Exposure with full tonal range - detail in shadows and highlights and midtones close to center of histogram
Image 2:
Underexposed image - histogram bunched-up on the left
Image 3:
Overexposed image - histogram bunched-up on the right
Image 4:
Exposure with clipped shadows - histogram abruptly stops on left side
Image 5:
Exposure with clipped highlights - histogram abruptly stops on right side
Not everything is perfect...
Not all images fit neatly within the edges of a histogram. For example, low contrast scenes will display a histogram that doesn't reach either end of the range (because there are no dark or light areas in the scene). High contrast scenes will appear as bunched-up on both sides of the histogram (a lot of dark shadows and light highlights with not many mid-tones). With high-contrast scenes, it is typically better to expose for the highlights (prevent the histogram from clipping on the right side) in order to retain detail in the highlights. It is more favorable to have blocked-up shadows than washed-out highlights in the final photograph. If you want to capture ALL the detail in a high-contrast scene but you can't with a single exposure, you can create a HDR (High Dynamic Range) image by taking several exposures - one to get highlight detail, one to get shadow detail, and one for the mid-tones - and blend them together using editing software.
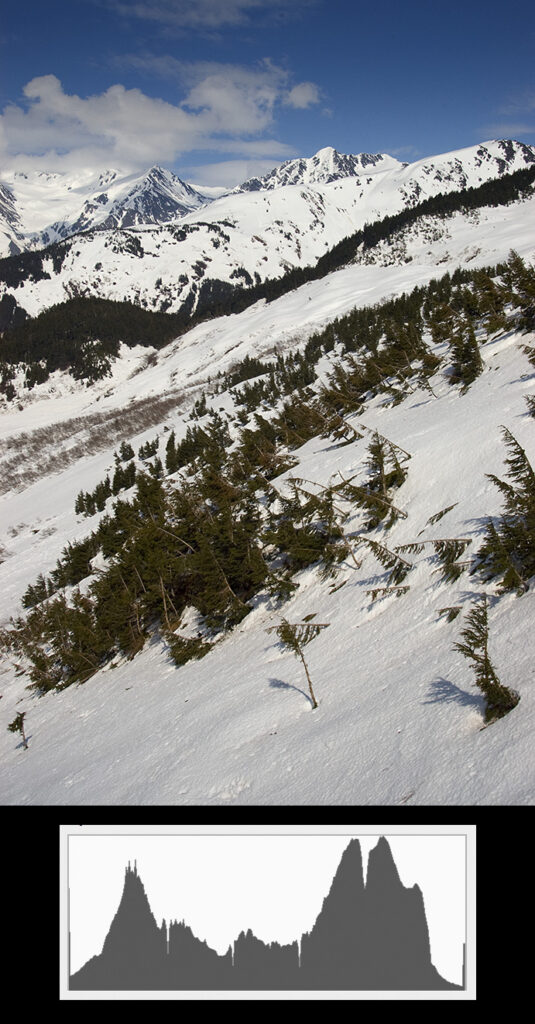
High-contrast scene
with histogram that peaks on either end.
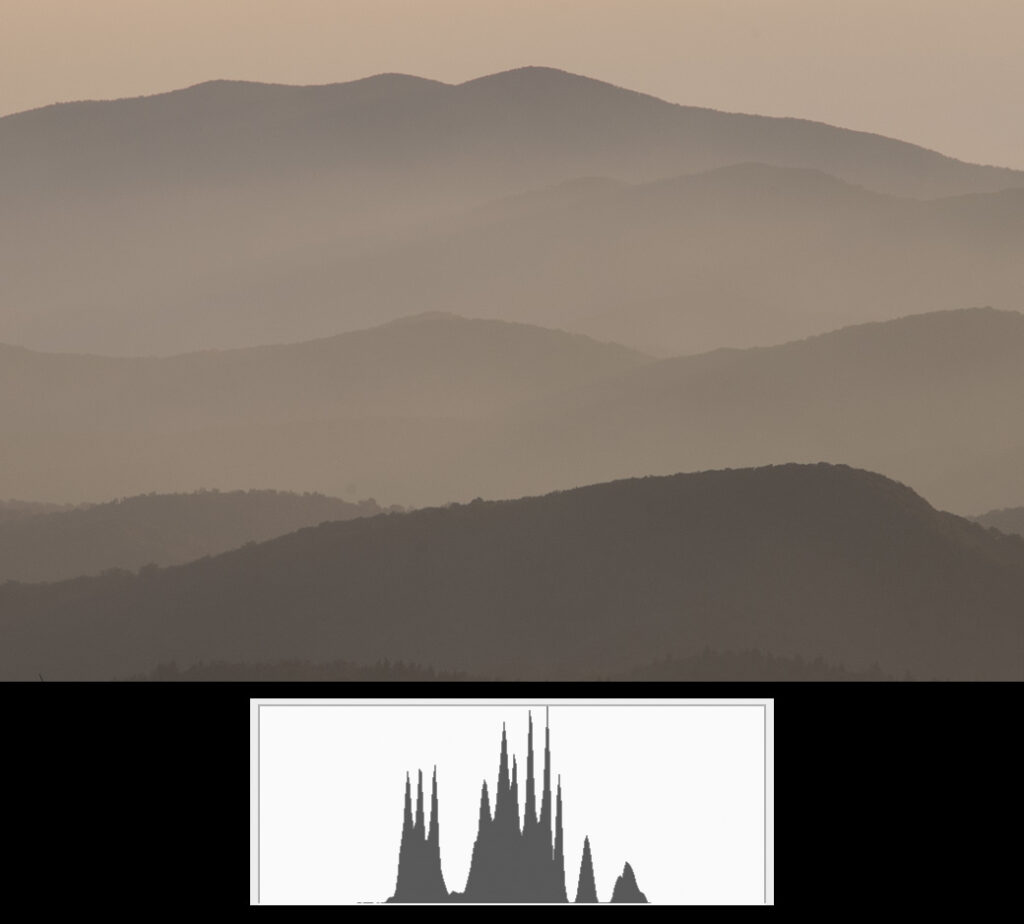
Low-contrast scene
with histogram doesn't extend to either side.
Don't Freak Out!
Don't become obsessed with "keeping everything within the edges" of the histogram. Most scenes have areas of extremely dark areas where there simply is no detail, or extremely light areas that are going to wash-out anyway (sun glaring off of water, for example) - so it is common for any histogram to show a bit of clipping on either or both ends. It's when you have a large chink of the graph clipped that you may want to reconsider your exposure.